Getting Started with DeskDirector
DeskDirector Portals
Browser Support
What is the DeskDirector Admin Portal?
What is the DeskDirector TECH Portal?
What is the DeskDirector Client Portal?
Desktop Portal
Managing Your Account
Pricing & Subscription Plans
Deskdirector - Sign up walk through
Managing your DeskDirector Subscription
Admin Essentials
Release Notes
Permissions & Feature Configuration (ConnectWise/Autotask Partners)
Automatic Contact Creation
The Developer Corner
DeskDirector Features Overview
Logging in to DeskDirector
Desktop Portal Version Differences
Managing Tickets with DeskDirector
User Profiles & Profile Pictures
Office Hours
How Searching Works
Embedding Help Page Media
Get started with the DeskDirector Power Automate Connector
Features
Portal Customization
Service Catalogue
Forms
Communication
Actionable Messages for Emails
Real-Time Chats
Notifications
Email Notifications
Email Template Engine
Surveys
Broadcasts
Generative AI
Ticket Summary for TECH Portal
DeskDirector with Generative AI
Setting up AI Service Providers
AI Assistants in DeskDirector
Custom Tools for AI Assistants
Knowledge Bases for AI Assistants
Set up Microsoft Foundry Agent Service with DeskDirector Portals
Advanced
Login & Authentication
Contact Groups
Accounts and Companies
Contacts
Approvals
Task Lists
The Learning Center
Tags
Custom Domains
File Storage
Portal Deep Linking
Service Dashboard
Auditing and Analytics
Integrations
ConnectWise
ConnectWise Custom Menu Item for DeskDirector Tech Portal
ConnectWise
ConnectWise Quotes & Invoices
ConnectBooster
ConnectWise - Avoid Aggressive Notifications
AutoTask
Switching or Merging PSAs
QuoteWerks
Wise-Pay
TimeZest
BiggerBrains
OneNote Notebooks
Integrations - Frequently Asked Questions
IT Glue
Microsoft Teams App
Introducing the DeskDirector for Microsoft Team App
Installing the Microsoft Teams App (Client Mode)
Installing the Microsoft Teams App (TECH Mode)
Setting up Tags for Teams Discussions (TECH Portal)
Branding the DeskDirector Teams App
DeskDirector Teams App Notifications
User Groups Integration with Microsoft Teams
Setting up Content Security Policy (CSP)
Advanced topic: Setting up Tech & Client Mode in the same tenancy
Integrating Microsoft Teams with DeskDirector Tech Portal
Smart Alerts for TECH Users
Microsoft Power Automate
Actions
Solutions
Power Automate Template Gallery
Featured Solution: Teams Ticket Discussion
Featured Solution: Ticket Briefing
Power Automate Administration
Power Automate Connector - Setting up your first flow
DeskDirector Power Platform Connector Reference
Troubleshooting
Troubleshooting via Web Developer Tools
Diagnose Entities Tool
Troubleshooting DeskDirector Connection Issues
Permissions & Access - Common Issues
Tickets & Chats - Common Issues
ConnectWise Audit Trail - Exporting API Logs
Contact DeskDirector Support
Desktop Portal - Common Issues
Contact Impersonation
DeskDirector Desktop App - Installation Issues
Login & Authentication - Common Issues
Approvals - Common Issues
Email & Email Delivery - Common Issues
PSA Entity Syncing - Common Issues
PSA Integration - Common Issues
ConnectWise Integration - Common Issues
Autotask Integration - Common Issues
Microsoft Teams App - Common Issues
Security
Glossary
Archived
Table of Contents
- All Categories
- Features
- Service Dashboard
Service Dashboard
 Updated
by Niamh Ferns
Updated
by Niamh Ferns
Service Dashboard Overview
The Dashboard can be found in your Admin Portal under the Dashboard tab. The dashboard provides you with access to a few key areas:
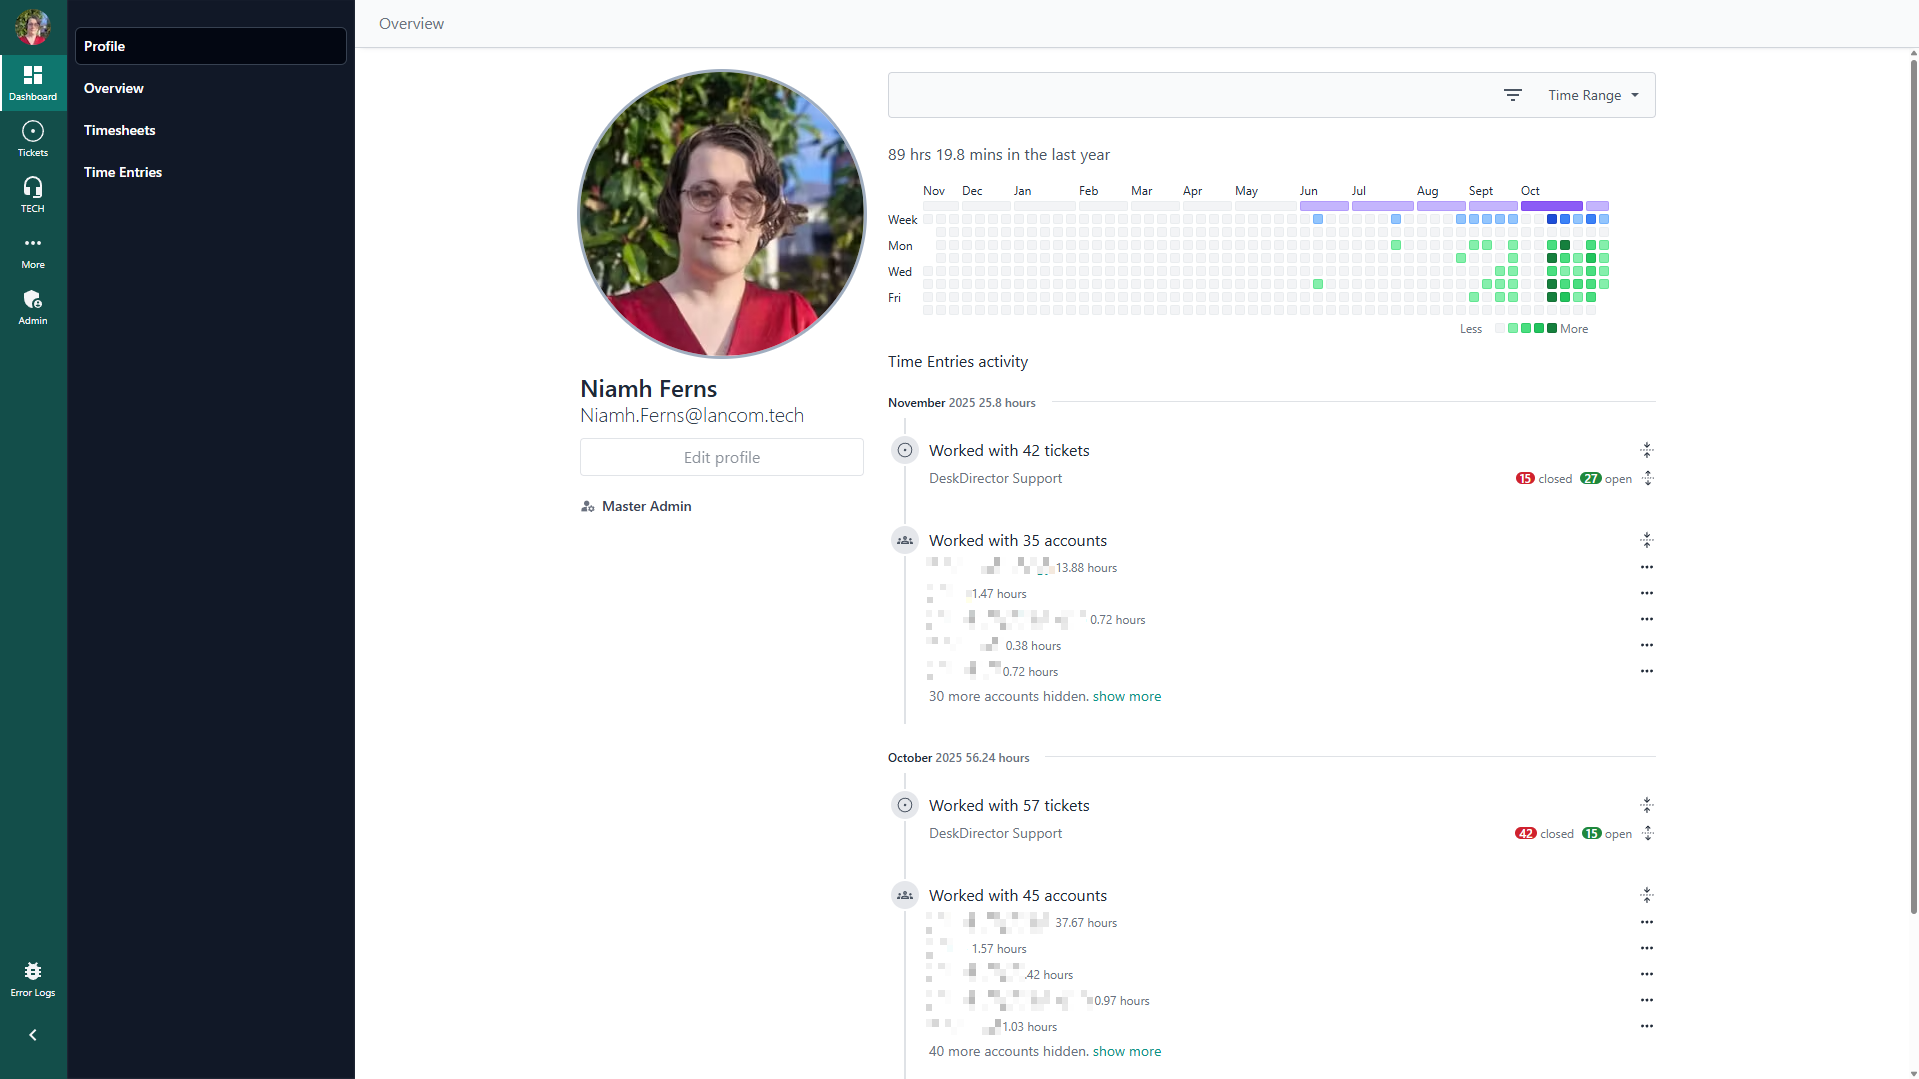
Profile
Under the profile tab, you can see a brief overview or your time entries, the accounts you've worked on, and some at-a-glance stats for the person currently logged in:
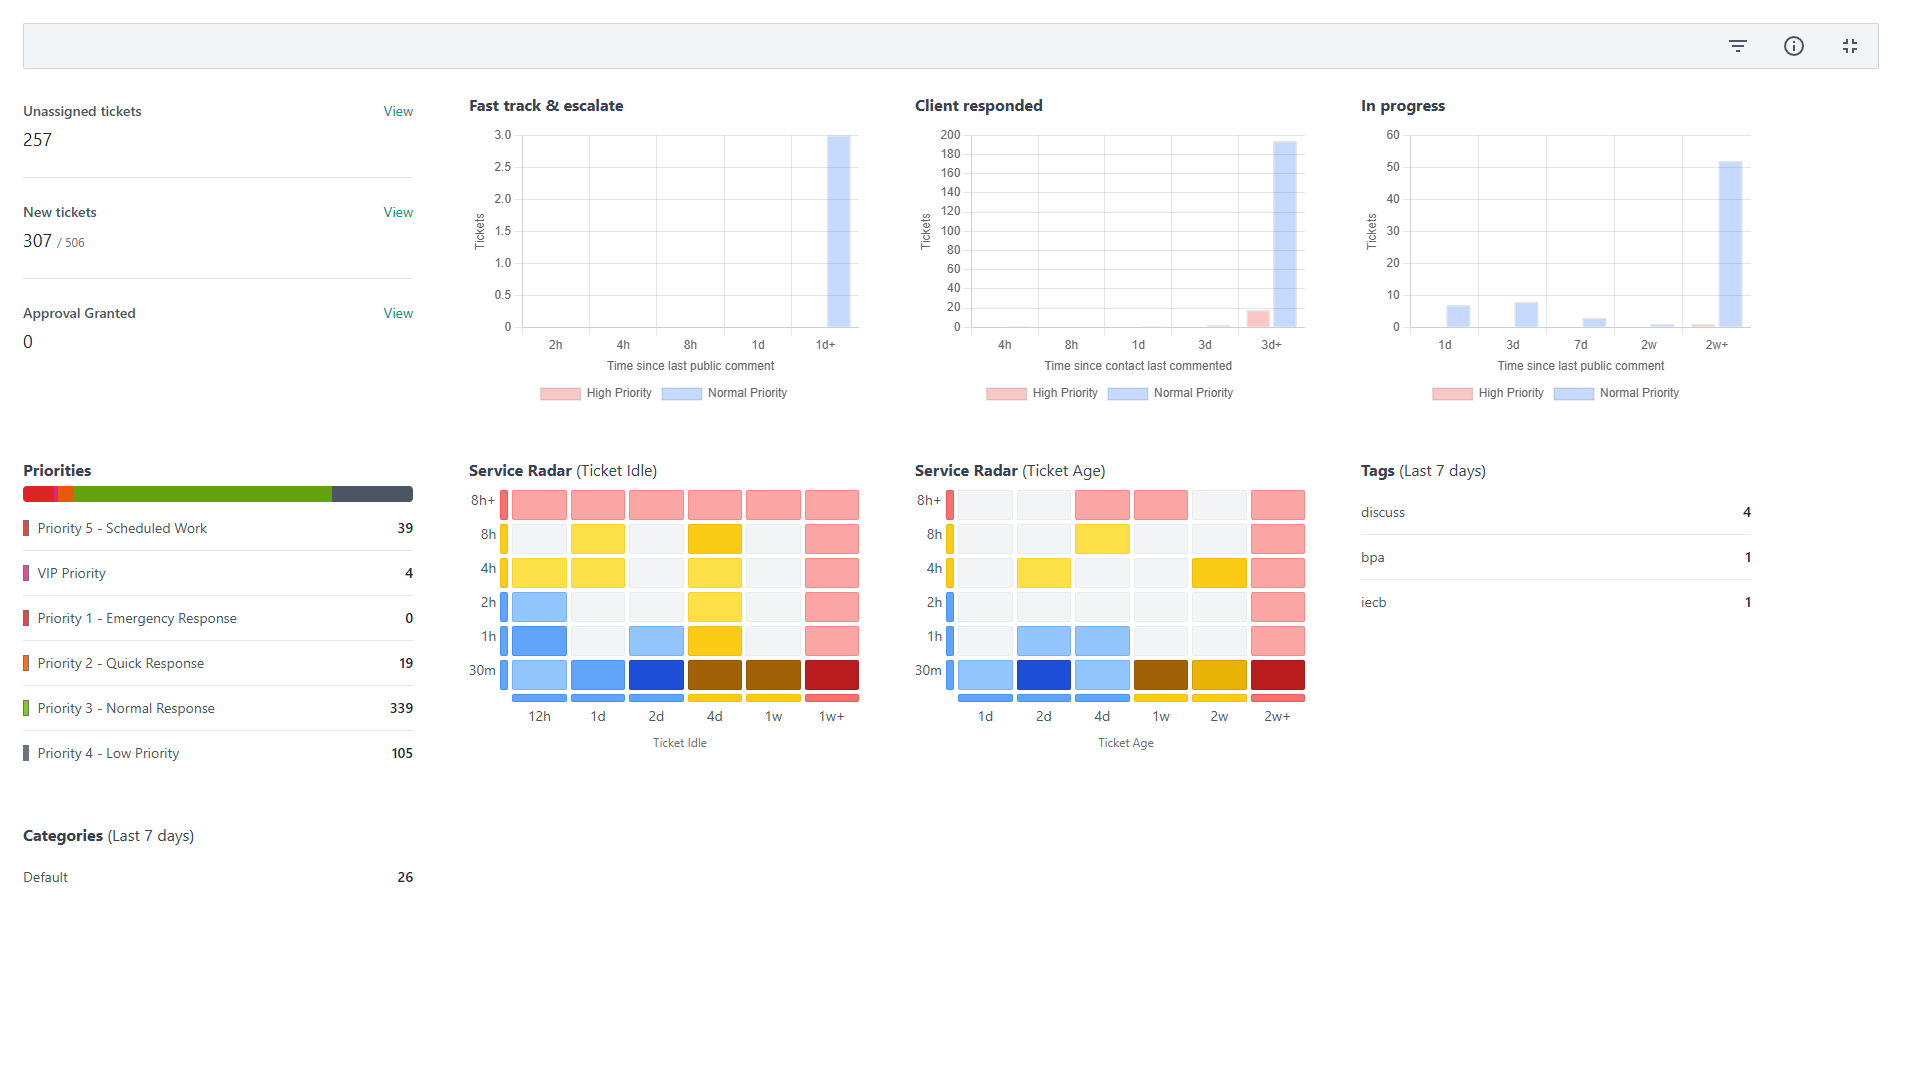
Overview
The Overview page will provide you with a set of Graphs that can be used to get an at-a-glance update on the current state of your service quality. You will see:
- Unassigned/New/Approved Tickets
- Fast track & Escalate Tickets
- Tickets Under Client Responded Status
- Tickets In Progress
- Tickets by Priority
- Service Radar (By tickets idle and by age.)
- By Tag
- By Category
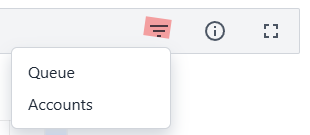
You can filter your overview by Account or Queue as well:
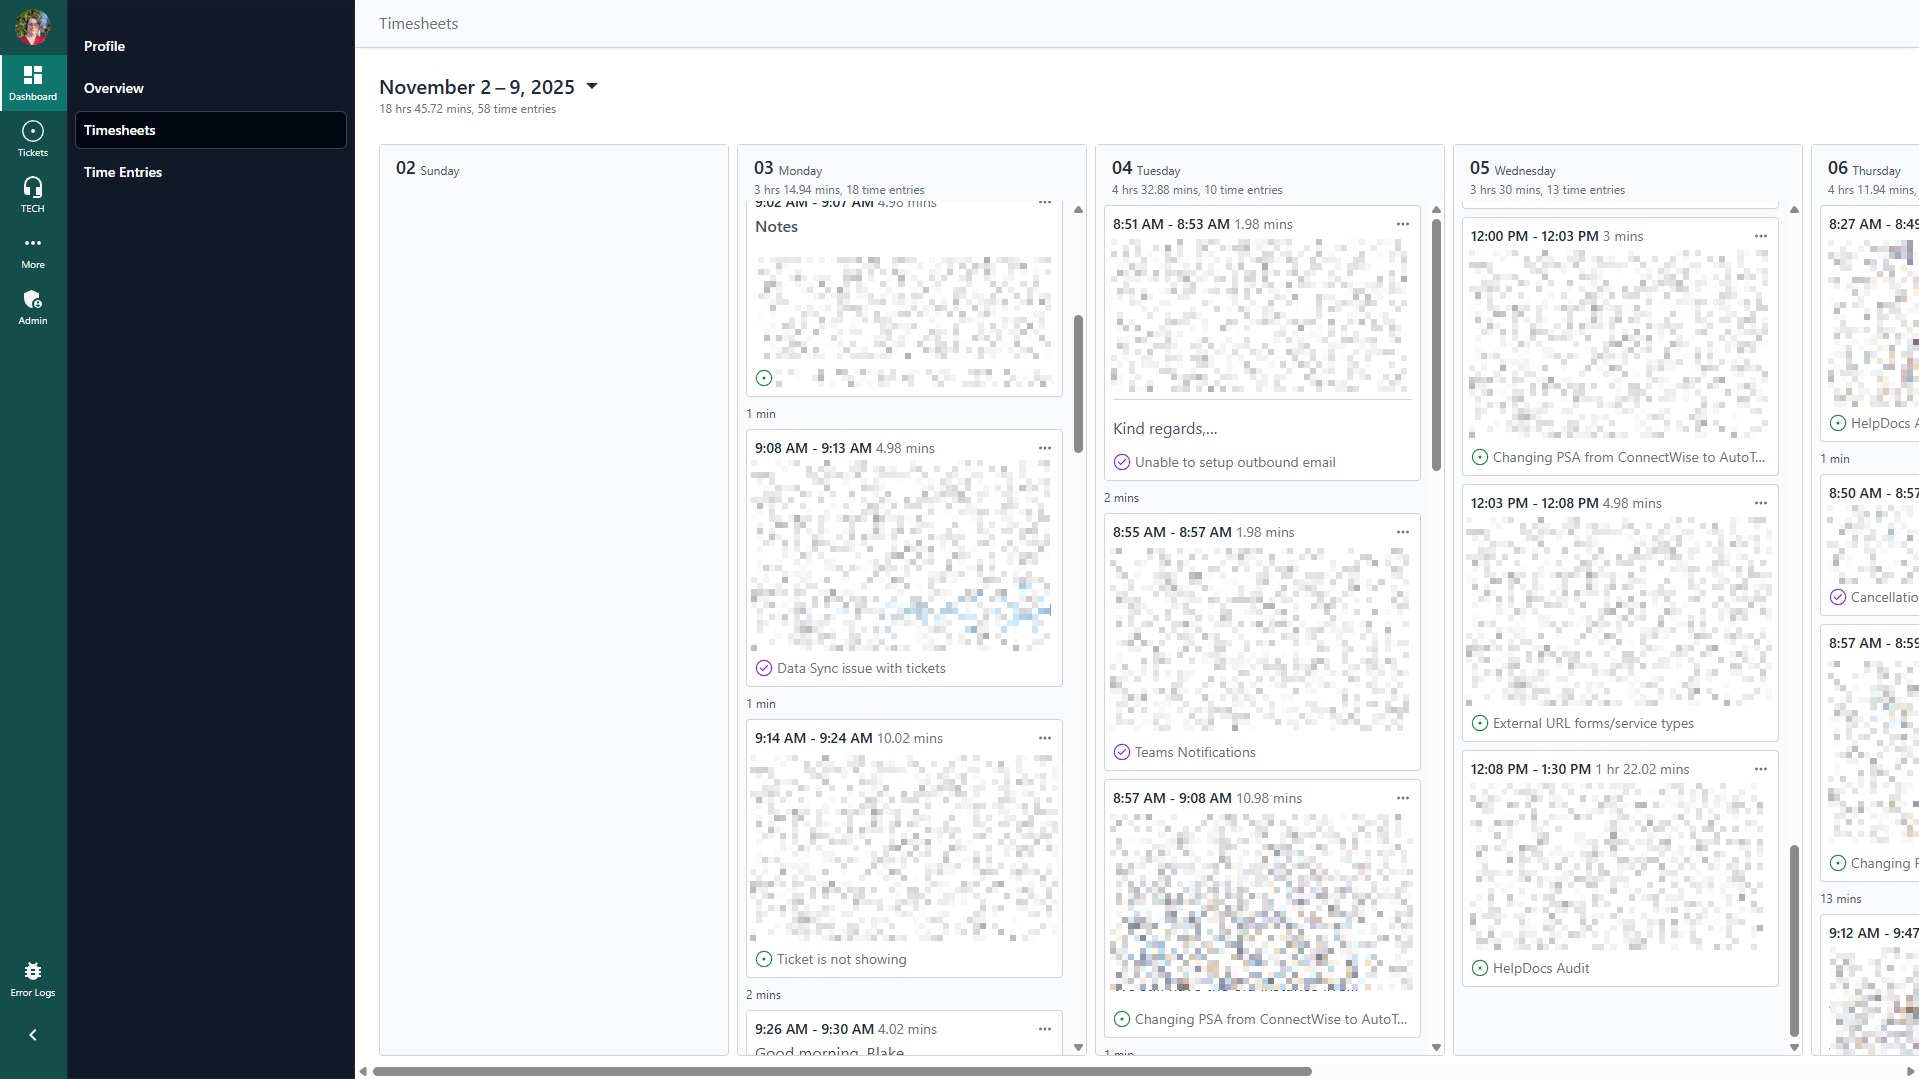
Timesheets & Time Entries
Under the Timesheets tab, you'll see a view of your existing time entries, what day they were made, and the related note added for these entries:
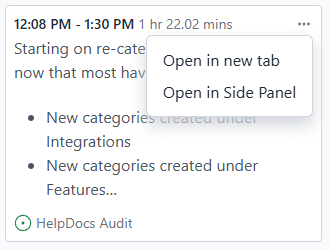
You can open an individual entry as well to view the ticket in a new tab or in a side-by-side view:

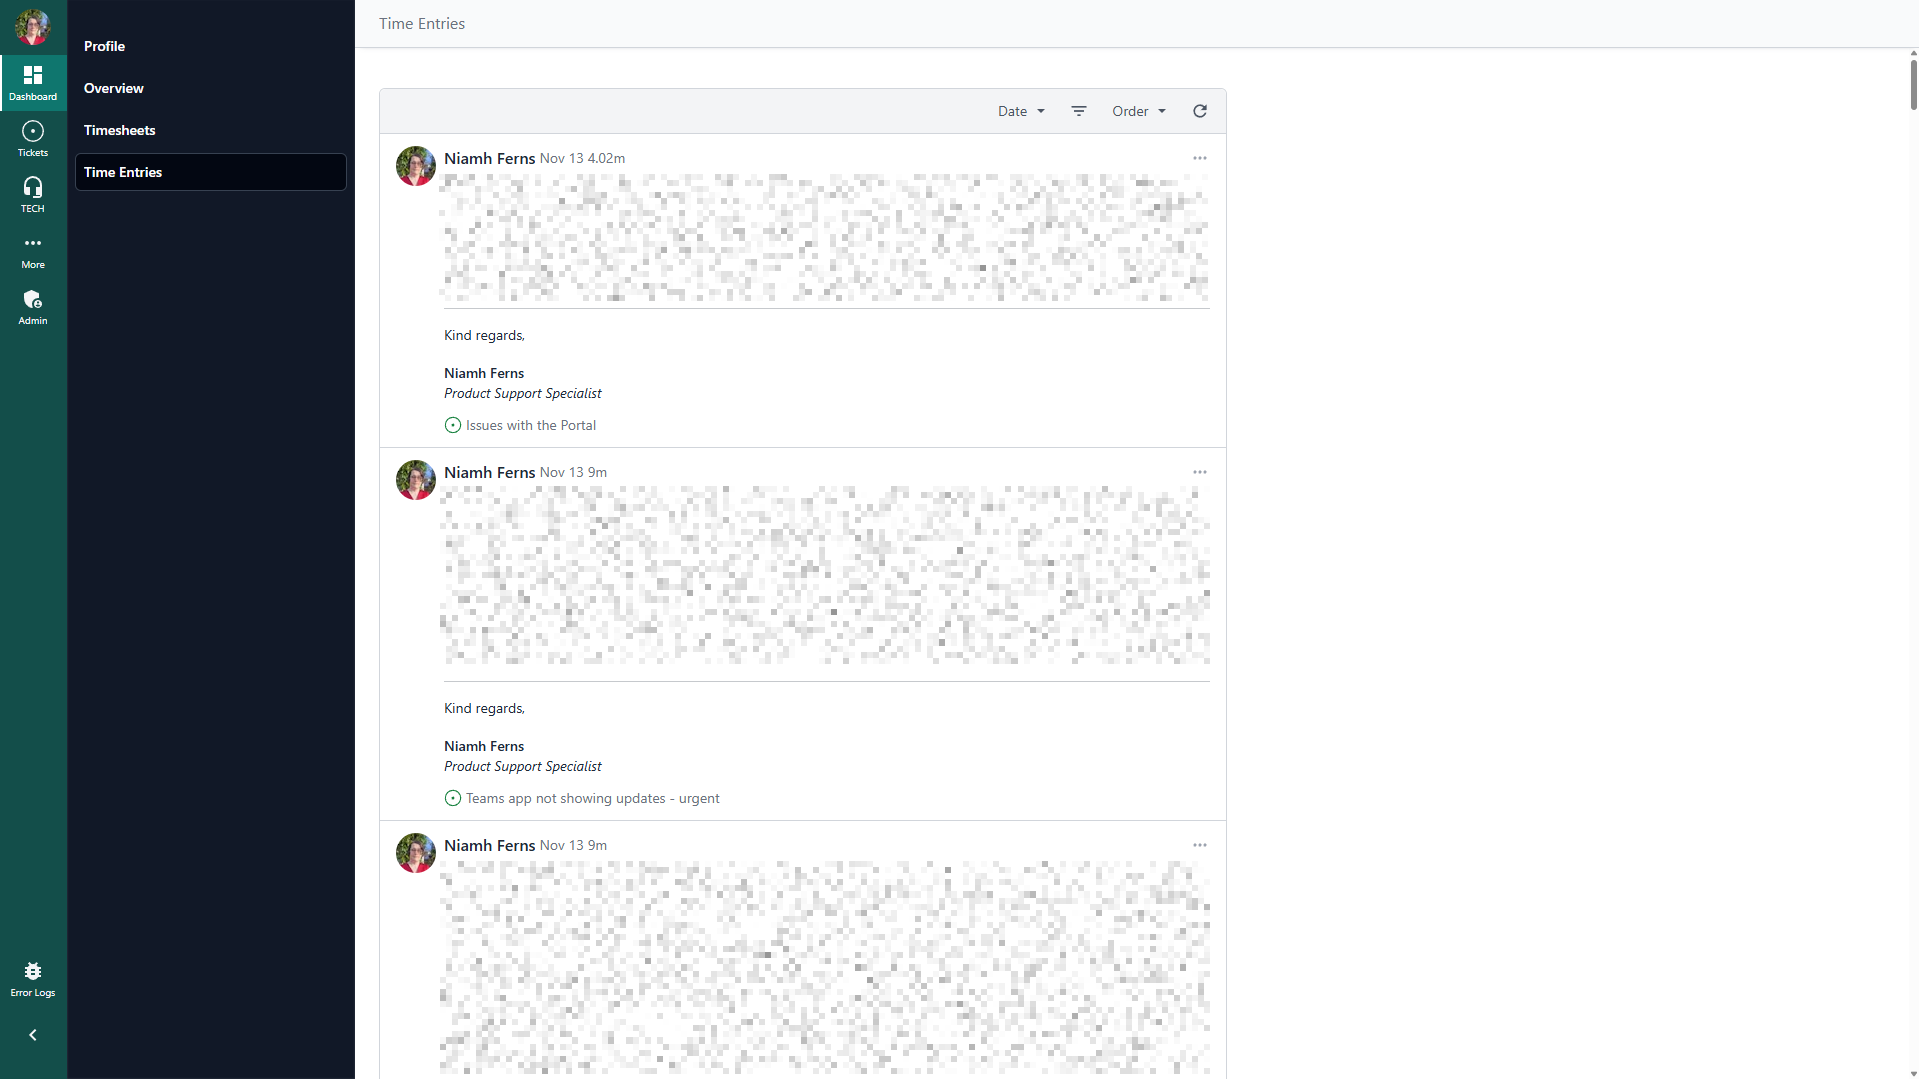
Under the Time Entries tab, you see a list of your time entries and can filter by date, account, or change the ordering:
Service Radar (PSA Partners Only)
It can be found in the Admin Portal under the Service Radar tab.
The Service Radar provides a clean, intuitive, and fast way of seeing your ticket statistics at a glance. It can be useful in seeing where your service is doing well and also where you may want to look for improvements to provide to your end users.
You can access this tool via the Admin portal under Service Radar. On initial load, you will be asked which service board/queue you'd want to check. Select the board(s) you want, then the graph will load with plotted points that represent a specific ticket colour-coded based on their priority, carefully plotted to the graph based on their ticket age/idle time and the actual hours spent.
You can adjust the Boards, Priorities, and Companies filter to your liking. Hovering over the colour-coded points should show a few of the ticket details, and clicking on them should open the specific ticket in a new window.
The Service Radar will re-sync every 5 mins. You can also force it to trigger a re-sync using the information icon in the upper-right corner, then clicking "Trigger resync data".