Table of Contents
Desktop Portal - Common Issues
 Updated
by Niamh Ferns
Updated
by Niamh Ferns
Diagnosing Desktop Portal Issues
This article explains how you can diagnose issues for the DeskDirector Desktop Portal. Information gathered through the process is also great to help out with any support ticket you create. It can help us resolve your issue faster.
Checking the Portal Version
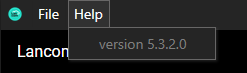
A good first step in isolating any issue with the desktop portal is to make sure you are running on the latest version. We frequently release patches for all of our portals to address new issues as they arise. You can get your version from the Help menu and then, if needed, verify this against the latest version available in your Admin Portal under Client Portal > Desktop Installer.
Portal Version
In this example, our portal version is 5.3.2.0
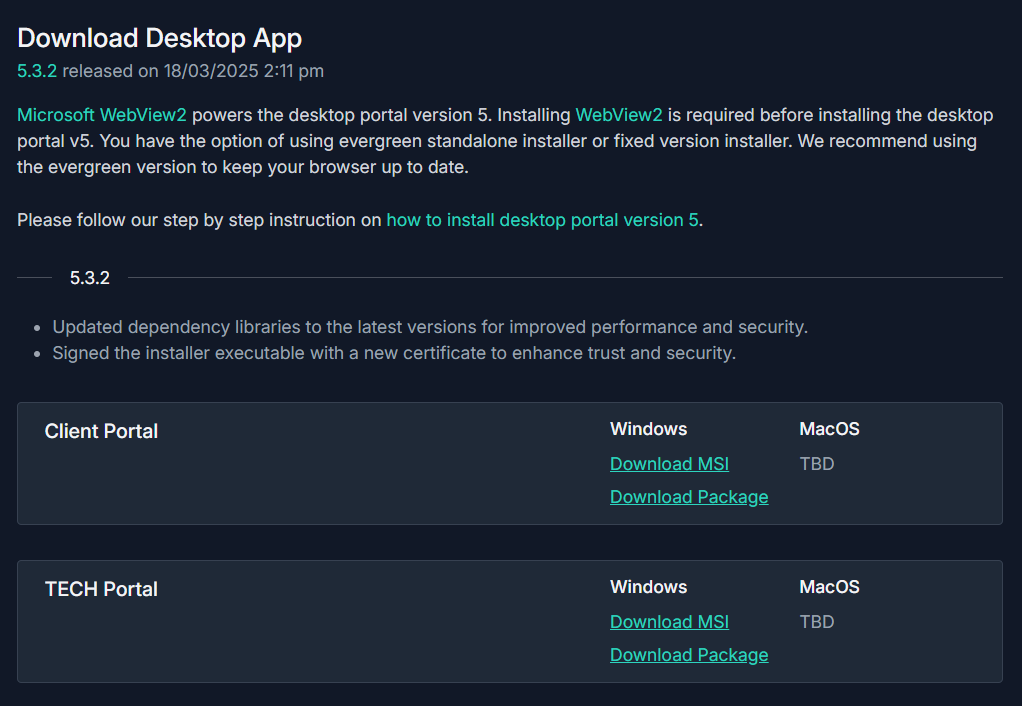
Admin Console
In this example, the latest portal version available in the admin console is 5.3.2.0
Our support team also needs this information when you reach out for help.
Checking User Info
When an issue occurs in the desktop portal, we need to check who is currently logged in. Many times, an email address could be associated with multiple users. This can only be performed in the desktop portal that already has a user logged in.
Open the desktop portal and check the name/email for the user that is currently logged in as well as what company they are logged in under:
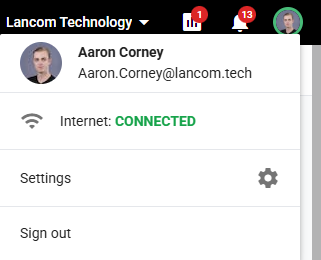
If a contact shares an email address with contacts from other companies, the option to Switch Companies is available within the client portal.
Next, open your Admin Portal and impersonate the affected user. Once you have impersonated the user, navigate to https://{sub-domain}.deskdirector.com/portal/v2/diagnostic
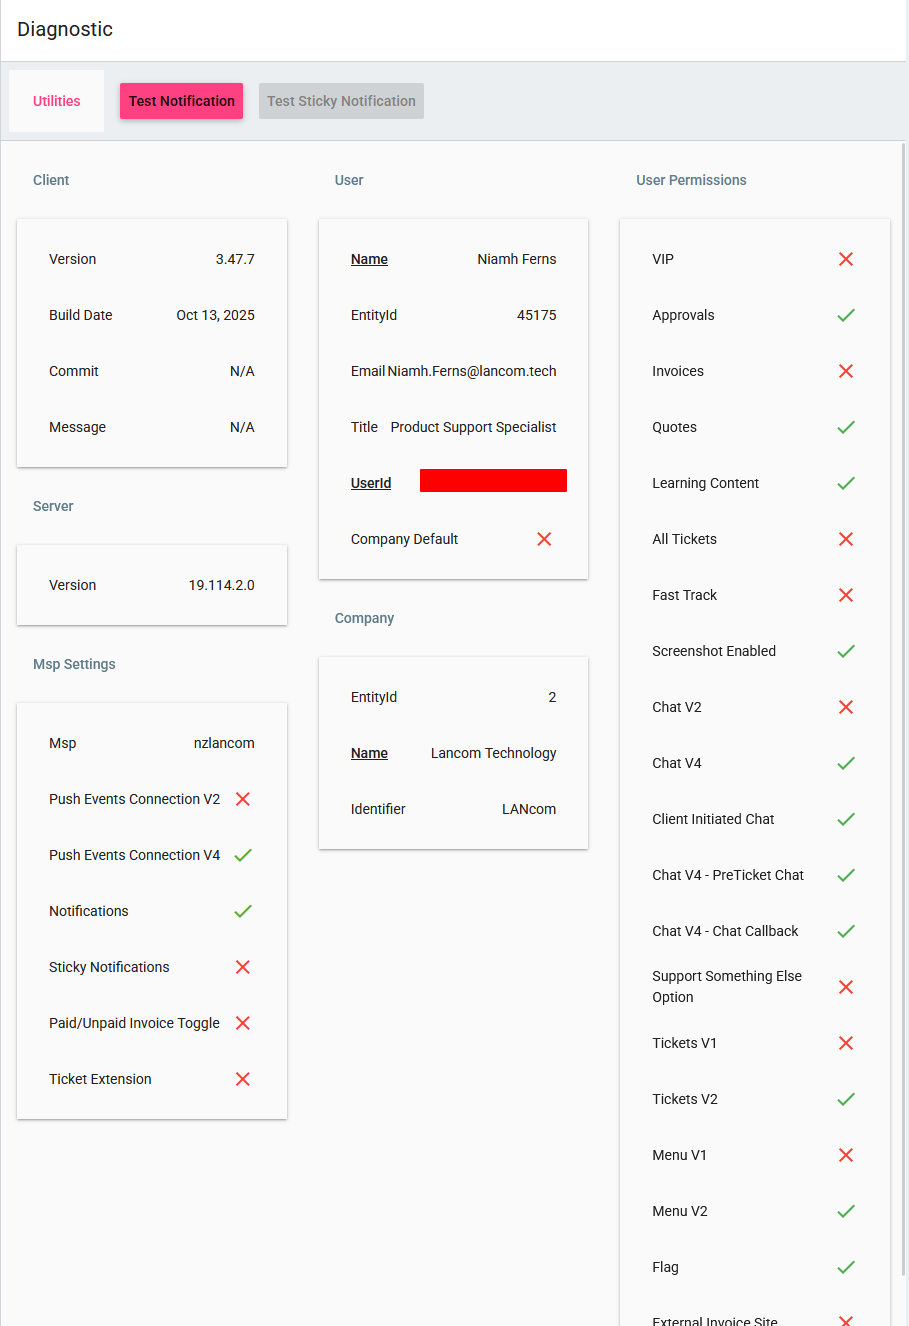
From this view, you can see the user ID and other useful information to show what the user does and doesn't have access to.
Developer Console
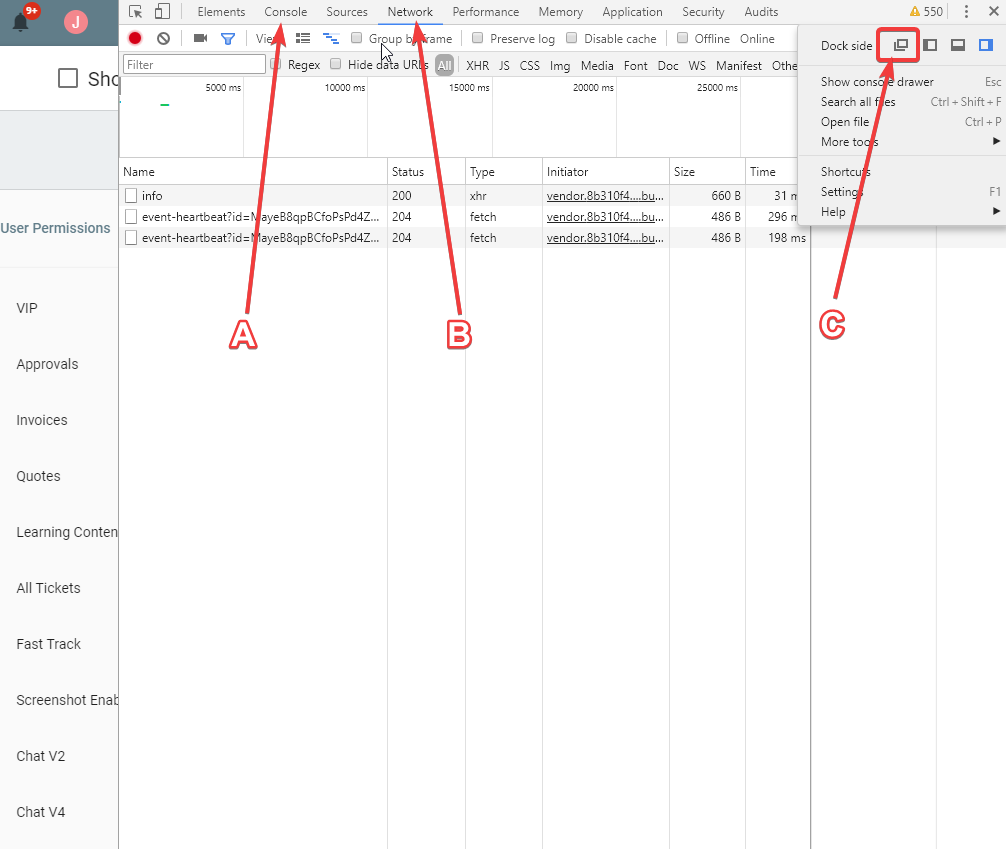
These are also known as the DevTools on Firefox or Developer Tools on Chromium. You can press Ctrl + Shift + I or Cmd + Shift + I. You will see the following:
Our Troubleshooting via Web Developer Tools article covers how to generate and export a .HAR file, a JSON-log of allnetwork requests and responses between a web browser and a website.
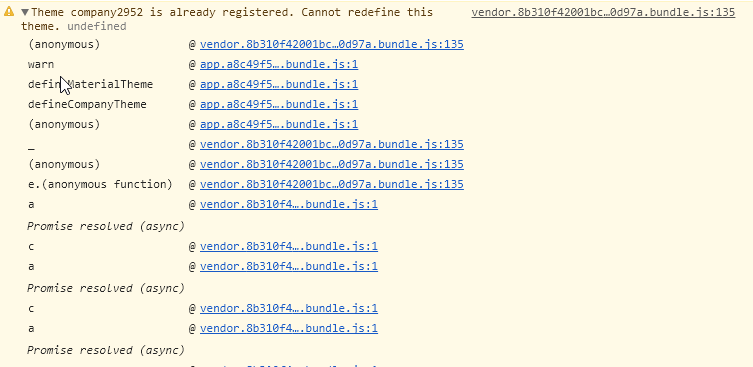
Console Panel
Inside the Console Panel, you can see application logs. If there are any errors from the web portal, they should appear there. You can also expand the error to see more details. Error messages should display in red.
Network Panel
The network panel should be empty when you open the developer console. Any HTTP request initialised after you open the developer console should display here. You can navigate to other pages, then back, to check all the requests that have been made on the problematic page. You can also reload the portal by going to View > Reload or by pressing Ctrl + R.
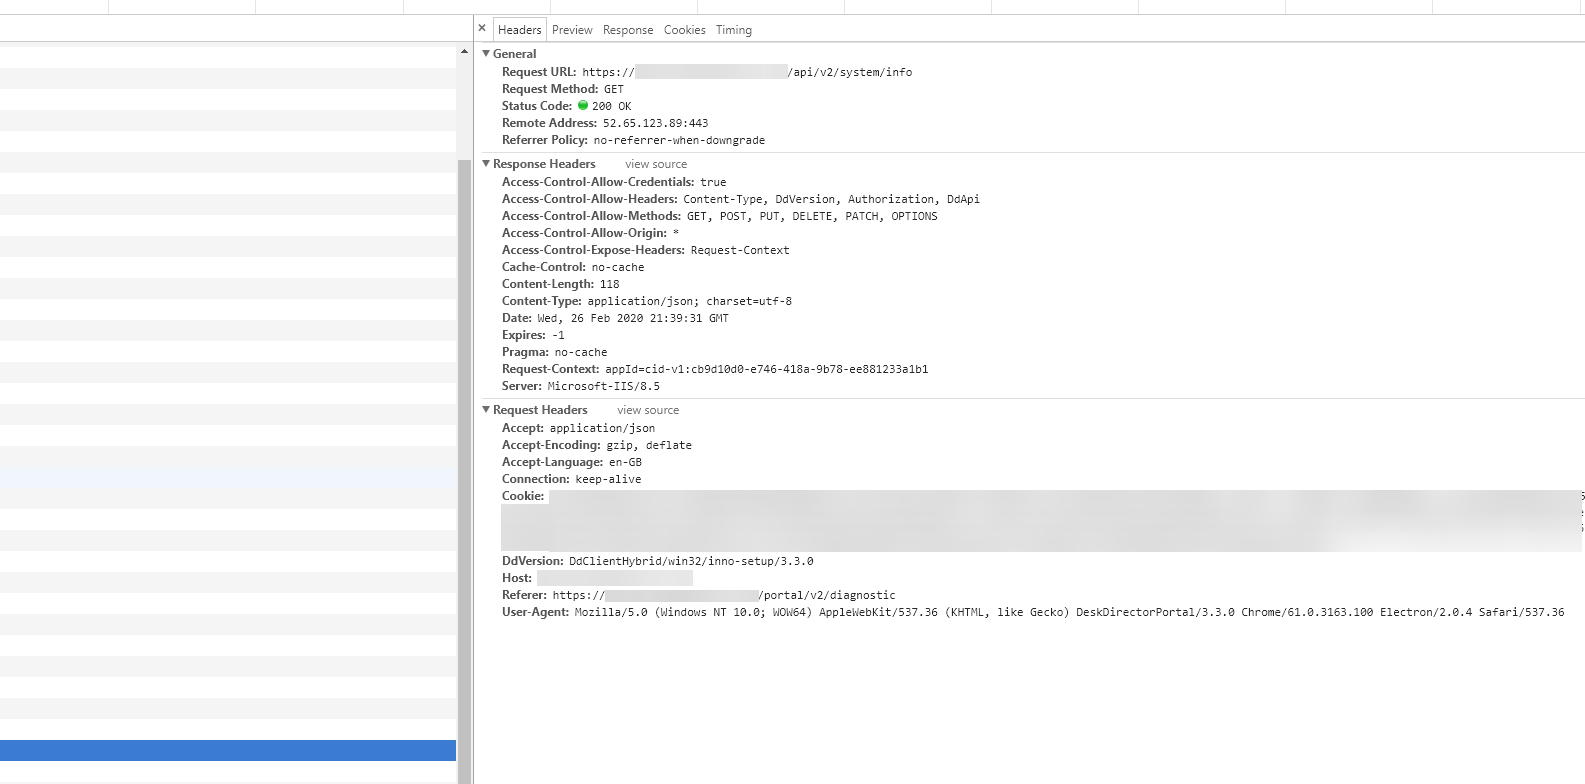
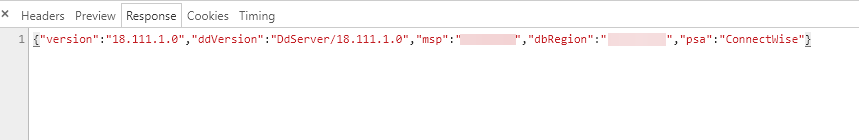
You should also copy over the value from the response tab. So our support or development team can review the response from the server.
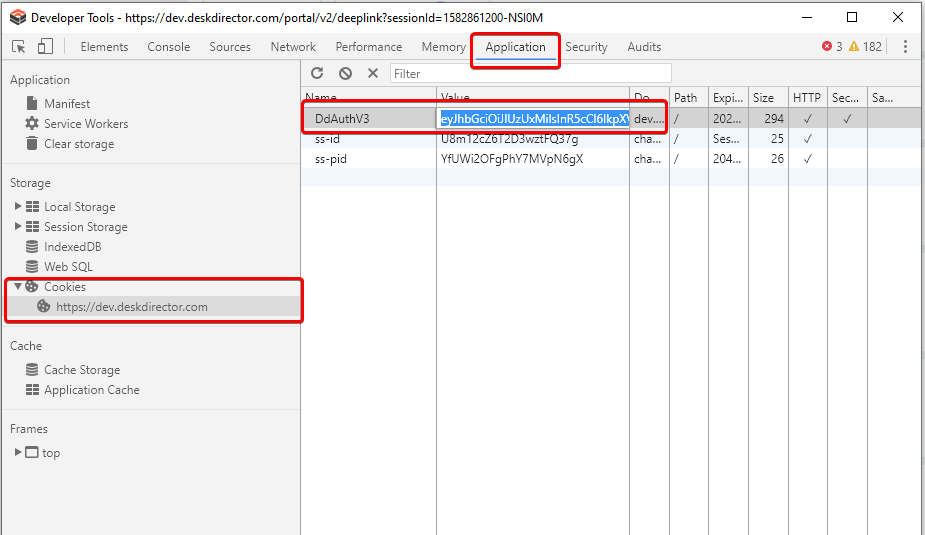
Check User Sessions
The cookie under the Application tab contains the information for the current user session.
Authentication
To diagnose single sign-on through Active Directory, you can check our article on the DDGetSID CLI Tool. In this article, you will also be able to see other login methods and their troubleshooting steps.
Common Issues
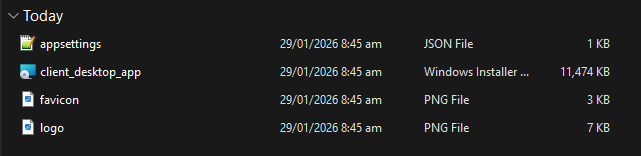
"I'm getting a missing appsettings.json error."
This app settings file appsettings.json specifies the important settings of the desktop portal that is being installed, e.g. the portal branding name and the server endpoint of your DeskDirector instance. Please make sure the file exists in the same folder as the installer.
Note that when the installer package is downloaded from the Admin portal, the appsettings.json file is automatically created in the package. Please unzip the package first. Go inside the directory where the files are extracted, then attempt the installation of the app from there.
The error normally triggers if the installer is clicked from inside the zip file; thus, it does not see the physical location of the appsettings.json file.
{
	"Homepage": "https://customer.deskdirector.com/auth/v1/embedded",
	"TechPortalMode": false,
	"PortalName": "Support Portal"
}
"I'm getting a missing favicon.png or logo.png error."
The branding icon files favicon.png and logo.png are required when installing the Client portal. Please make sure they are in the same folder as the installer. When installing the Tech portal, these files are optional.
If installing the desktop app using the package, please unzip the package first. Go inside the directory where the files are extracted, then attempt the installation of the app from there.
The error normally triggers if the installer is clicked from inside the zip file; thus, it does not see where the physical location of the favicon file is.
"I'm having some other installation issues."
Please check the logs and review our troubleshooting documentation.
Client portal Logs:
%localappdata%\DeskDirector Portal\logs
Tech Portal Logs:
%localappdata%\DeskDirector Tech\logs
No installation logs:
If the installation of the desktop app is failing, and there are no logs in the directory mentioned above, you can create Windows installation logs.
Please follow this guide on how to create installation logs.